An LLM data pipeline has more than one meter running: model tokens, warehouse bytes scanned and third-party API allowances. Any one of them can turn a bug into a bill overnight, and a cap that does not sit on every code path is only a hope. Below is how Baseline, a market and geopolitical intelligence platform on Google Cloud, layers spend caps, makes partition pruning a requirement rather than a habit, and treats every projected saving as unproven until it is measured.
Baseline turns news and public data into scored intelligence signals using Gemini models on Vertex AI, with external sources landing in BigQuery. That gives it three cost surfaces, and each has its own controls.
Caps in layers, each with a different job
Every model call is checked against three dollar caps, and each one exists to contain a different failure.
| Layer | Cap | What it contains |
|---|---|---|
| Per collection | $5 hard stop (warning at $1) | One runaway collection run |
| Per tenant, per day | $10 in dev, $25 in staging and production | One customer’s fault spreading to others |
| Org-wide, per day | $100; the scheduler refuses new runs | Everything else |
The tenant cap is deliberately loose. Measured steady-state cost for a 25-subject tenant is about $0.03 a day, so the $25 production cap is roughly 800 times that. It is sized so that a deep first-time onboarding cannot trip it, because a cap that breaks onboarding does more harm than having none. Dev runs tighter because that is where runaways are found.
The layers also expose each other’s limits. Without the tenant cap, one tenant’s runaway could use up the org-wide budget, and the scheduler would then refuse runs for every tenant: a single-tenant fault becomes a platform outage. The org-wide ceiling does not scale with tenant count, so four tenants at their ceilings trip it; it must be revisited as customers are added.
Dollar caps miss one failure: a loop of cheap or cached calls can stay under every limit while hammering the provider. A separate circuit breaker on org-wide calls per minute catches it, and zero-cost calls count.
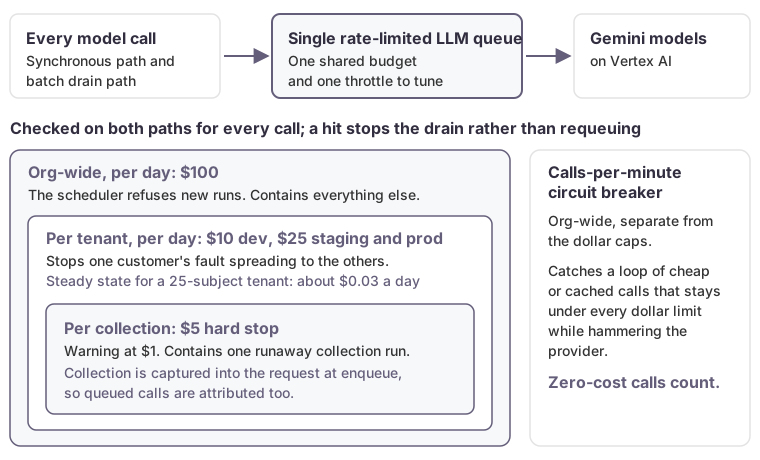 Three nested dollar caps, one queue, and a call-rate breaker for the failures dollar caps miss.
One queue, so there is one throttle
Every model call goes through a single rate-limited LLM queue with one shared budget, so there is one throttle to tune and no surprise exhaustion of a provider quota.
A single queue only helps if the caps run on every path out of it. Typically there are two: a synchronous path, and a drain path where workers process queued and batched requests. Baseline runs the same record-and-check step on both. When a cap is hit mid-drain, the drain stops rather than requeuing: the request already completed, and resending it pays twice.
Three design rules keep the meter honest:
- Meter at the provider layer. Record usage where the provider API is actually called, not in a wrapper some paths skip, so nothing escapes the meter.
- Carry attribution with the request. Tenant and collection scope often lives in process-local context, and that does not survive the hop to a separate drain worker. Capture both into the request when it is enqueued.
- Prove each cap is live. A cap whose setting defaults to zero, meaning disabled, enforces nothing until every environment sets it. Check the running configuration, not just the code.
Make partition pruning a requirement
At October 2026 list prices, BigQuery on-demand queries in the US multi-region cost $6.25 per TiB scanned after the first free TiB each month; some regions cost more. The bill follows bytes read, not rows returned: for a table that is not clustered, LIMIT does not reduce what is read. Google’s documentation says partition pruning happens only when a query filters the partitioning column, and only when that filter is a constant expression. A filter whose value comes from a subquery scans every partition.
The external-source registry shows the gap. Baseline’s daily crypto on-chain slice costs about $0.002 a day pruned to the day’s partition, about $1.84 unpruned, and one careless scan of the full traces table (about 13.7 TB) roughly $80–90 at on-demand list price. Steady-state ingest across all BigQuery-native sources is estimated, from measured per-source slices, at under $0.10 a day. The risk is not the steady state; it is one unpruned query against a large public table.
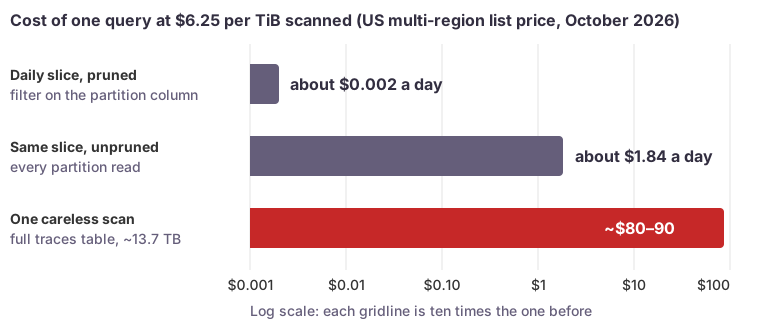 On a log scale, the gap between pruned and unpruned is three orders of magnitude.
So pruning is enforced by configuration, not left to reviewers:
- Every BigQuery-native landing job sets a maximum-bytes-billed value read from that source’s entry in the registry. BigQuery estimates the bytes before running the query, and if the estimate is over the cap, the query fails without being charged. The job records the failure instead of overscanning.
- Tables we own are designed to require a partition filter. With that option set, BigQuery rejects any query that has no filter it can use to eliminate partitions.
CREATE TABLE <dataset>.bronze_<source> (
  event_date DATE,
  payload    JSON
)
PARTITION BY event_date
OPTIONS (
  require_partition_filter = TRUE,
  partition_expiration_days = 90
);
from google.cloud import bigquery

job_config = bigquery.QueryJobConfig(
    maximum_bytes_billed=source.cost_cap_bytes,  # from the source registry
    query_parameters=[bigquery.ScalarQueryParameter("day", "DATE", run_day)],
)
rows = client.query(landing_sql, job_config=job_config).result()
The byte cap matters most on public datasets, where you cannot set table options. Backfills run as separate, day-ranged jobs with a byte cap on each chunk.
Projected savings are hypotheses
The third meter was Event Registry (now sold as NewsAPI.ai), a news API billed in tokens against a monthly allowance. Its October 2026 plans page prices a search over the last 30 days at 5 tokens for events and 1 token for articles, per request, however many results come back; archive searches cost more. Our measurements matched. When the production allowance ran short, we made a series of changes, and their measured results differed from what we projected.
- Cadence. Halving production’s refresh frequency, from every 6 hours to every 12, was projected to cut token use by 50%. Measured over the following 29 hours, the cut was 29%, which left almost no margin before the allowance reset. We moved production to a 24-hour refresh.
- Batching. Pulls for individual tracked subjects made up 223 of 364 daily event-search calls. Since a request costs the same whatever it returns, we combined five subjects per query, projecting about 45 calls a day instead of 223. Measured in a test environment, the first version’s guard, which accepted a batch only when no subject’s results were cut off, almost never accepted one, so it would have added a call per chunk and saved nothing. A per-subject check replaced it.
- The meter itself. A saving can only be measured by a meter that sees every call. Every client that reaches the provider has to log usage, and a cost logged as “unknown” usually means a parsing bug, not a provider that withholds the figure.
The rules we now follow:
- Measure over at least one full cycle before reporting a saving.
- Reconcile your meter against the provider’s own counter. Here that was a remaining-allowance header returned on every response.
- Keep live numbers in a tracked issue where they can be updated, not frozen into code comments.
The same habit runs through our LLM spend reduction work: attribute first, change one thing at a time, and believe only full-window measurements.
How we can help
We put cost controls into LLM and data pipelines: layered spend caps, attribution by tenant and workload, and warehouse guards that fail before they charge. We measure each change against real traffic before calling it a saving. Get in touch if your model or warehouse bill is growing faster than your usage.