A health probe is the only thing standing between a broken server and your customers, and it only knows what you tell it to ask. On one production web estate we found three probes giving three different wrong answers: one failed healthy servers, one passed servers it never really checked, and one gateway’s default probe produced intermittent 502 errors for users. A probe that cannot fail is arguably worse than no probe, because it hides outages behind a green dashboard.
The client runs a .NET e-commerce platform on Linux virtual machine scale sets in Azure. nginx terminates HTTP and HTTPS on each instance and proxies to a .NET application. An internal Azure Load Balancer sits in front of each scale set, and an Azure Application Gateway handles public traffic to the API tier.
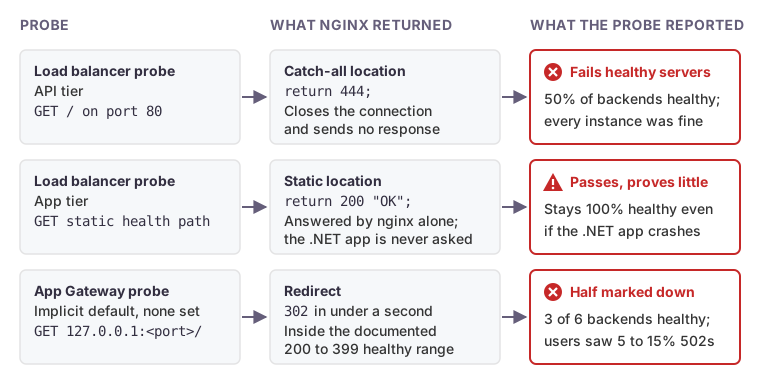 The three probes on one estate, and what each actually received from nginx.
Probe one: failing servers that were fine
At the Azure level every instance was running, with nginx and the application service both active. Yet the load balancer for the API tier reported only 50% of its backends as healthy, and plain HTTP requests from outside got nothing back at all.
From inside an instance, curl http://localhost/ returned an empty reply, while a request to a static health path on the same port returned 200. That pointed at a location rule, not a server fault. The port-80 server block ended in a catch-all that read return 444;. In nginx, 444 is a non-standard code that closes the connection without sending a response. A commented-out line right beside it showed what had been intended, an HTTP-to-HTTPS redirect.
The load balancer probe targeted / on port 80, so every probe hit the 444 and failed. Users who typed http:// got a blank tab; HTTPS users were fine.
We replaced the 444 with a 301 redirect on every instance, validated the config with nginx -t, and reloaded gracefully. That fixed users, but not the probe. Azure Load Balancer HTTP probes treat only HTTP 200 as healthy, and any other code, redirects included, marks the instance down. We had swapped one failing response for another. The second change repointed the probe at a path that returns 200, after which availability went to 100% within about two minutes.
Probe two: passing servers it never checked
The application tier’s load balancer had reported 100% healthy the whole time. Its probe targeted a health path that nginx answered with a hardcoded return 200 "OK", from an exact-match location that takes precedence over the broken catch-all. The response came from nginx alone and never touched the application.
That probe proved nginx was running, and nothing else. If the .NET process had crashed, every instance would still have reported healthy and kept receiving traffic.
Probe three: the gateway’s default probe
After the load balancer fixes, users were still seeing 502 errors through the Application Gateway, around 5 to 15% of requests. Only one backend 5xx appeared over 30 minutes, so the gateway itself was generating most of the 502s, consistent with the gateway treating backends as unroutable. Gateway metrics showed only 3 of 6 backends healthy on average.
No custom probe was configured, so the gateway used its implicit default probe. Per Microsoft’s documentation (as of October 2026), that probe sends a GET to <protocol>://127.0.0.1:<port>/, inheriting protocol and port from the backend settings, every 30 seconds with a 30-second timeout and an unhealthy threshold of 3. It treats status codes from 200 to 399 as healthy, and it uses 127.0.0.1 as the host unless the backend settings specify one.
Here our observations and the documentation disagreed. The backend access logs showed the probes arriving and nginx answering with a 302 in well under a second, a code inside the documented healthy range. Yet gateway metrics held half the pool unhealthy, and the backend health view reported “Cannot connect to backend server”. We attached an explicit custom probe with a named host, a deterministic path and the same 200–399 match range, and failed requests dropped to zero within two minutes, with all 6 backends healthy.
We never isolated which part of that change mattered, because the path and the host changed together. The old path returned a redirect generated by the .NET application, so its timing varied; the new one is answered by nginx directly. On the v2 gateway a custom probe’s host is also sent as the TLS SNI, which Microsoft recommends for backends serving a wildcard certificate, as these did. Both are working theories. The lesson does not depend on them: do not let production rely on a probe you did not define.
The probe we left behind
Our own fix has a gap. To stop user-facing errors quickly, both repaired probes now point at static nginx paths. That restored correct routing, but it carries the same weakness as probe two: a crashed application would still look healthy. The gateway probe also still accepts any code from 200 to 399. We documented this as a known limitation and recommended a deeper endpoint as the follow-up.
What a probe should actually check
A useful probe answers one question: should this instance receive new requests right now? That leads to a few rules.
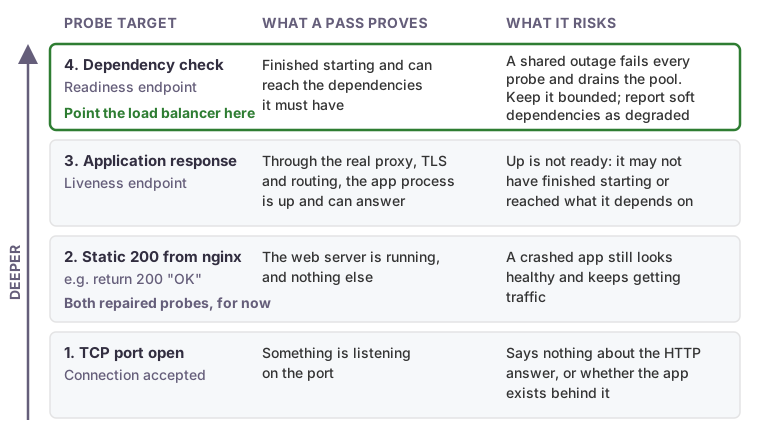 Each rung proves more. Both repaired probes sit on rung 2 for now; the load balancer belongs on rung 4.
- Probe through the real request path. Travel through the same proxy, TLS and routing as user traffic, and reach the application process.
- Expose a shallow endpoint and a deep one. A cheap liveness endpoint confirms the process can answer. A readiness endpoint confirms the instance can actually serve: it has finished starting and can reach the dependencies it must have. The load balancer should use readiness.
- Keep the deep check bounded. Check only dependencies that are local to the instance or would make it useless. If a shared database outage fails every probe at once, the balancer drains the whole pool, so return a degraded status for soft dependencies rather than failing.
- Match exactly what you expect. Expect a 200 and, where the platform allows, match a string in the body. Do not accept a range that includes redirects unless you mean it.
- Define every probe explicitly: host, path, port, interval, timeout and threshold. Defaults are starting points, not a contract.
- Prove the probe can fail. Stop the application on one non-production instance and confirm the probe marks it down.
A deep endpoint in nginx can be as small as this, with tight timeouts so a hung application fails fast:
location = /healthz {
    proxy_pass http://127.0.0.1:<app-port>/health;
    proxy_connect_timeout 2s;
    proxy_read_timeout 3s;
}
The gateway probe then targets that path with an explicit host and an exact match, and has to be attached to the backend settings before it replaces the default:
az network application-gateway probe create \
  -g <resource-group> --gateway-name <gateway-name> -n app-health \
  --protocol Https --host <public-hostname> --path /healthz \
  --interval 30 --timeout 30 --threshold 3 --match-status-codes 200

az network application-gateway http-settings update \
  -g <resource-group> --gateway-name <gateway-name> \
  -n <backend-settings-name> --probe app-health
For a related case where every status light stayed green while customers were affected, see two SQL Server incidents where nothing crashed.
How we can help
We diagnose production routing failures from evidence: probe configuration, access logs and gateway metrics, read side by side. If your dashboards say healthy and your users disagree, talk to us and we will measure what your probes actually check.