A website that can’t tell you whether its contact form works, or whether visitors find what they search for, is running on assumption. We learned that the hard way when our own contact form failed silently for six days. Here is the observability we now run on hatboysoftware.com: no cookies, about one Lighthouse point of performance cost, and a few dollars a month at list prices.
What we wanted to know
Four questions, in order of business value:
- Did each enquiry reach the CRM? If not, someone should know within minutes.
- What do visitors do? Which calls to action they click, whether they phone or email, and what they search the blog for, including searches that find nothing.
- Is the site fast for real visitors? Lab tests are useful, but field data from real browsers is what counts.
- Is the site up, and is its certificate about to expire?
We also had constraints. No cookies, nothing that slows the first render, and no third-party analytics script deciding what to collect.
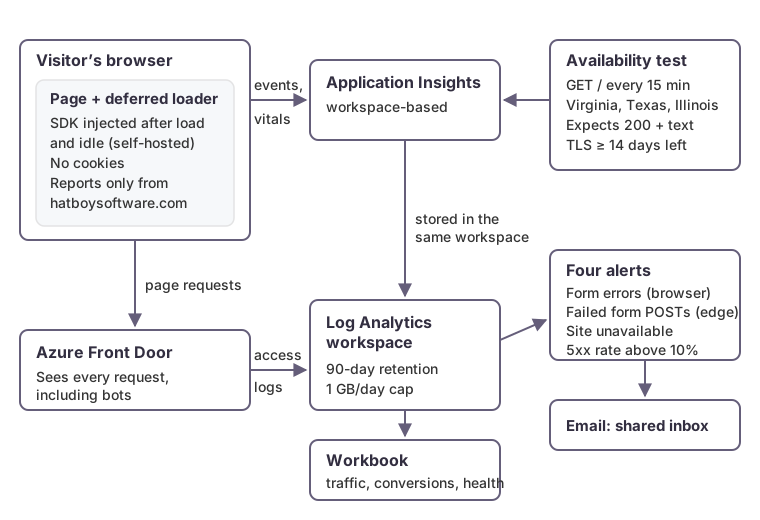 Browser telemetry and edge logs land in one Log Analytics workspace, so the alerts and the workbook can query both.
The browser side
We use the Azure Application Insights JavaScript SDK, wrapped in a small script of our own.
Privacy settings
- No cookies.
disableCookiesUsage: truestops the SDK reading or writing cookies. - No correlation headers to other sites. The SDK can add tracing headers to cross-origin requests (
enableCorsCorrelation). That’s off by default, and we keep it off, so calls to our CRM carry nothing extra. - No stored IP addresses. By default, Application Insights uses the sender’s IP for a geolocation lookup at ingestion, then discards it and stores
0.0.0.0. - Production only, live hostname only. The script renders only in production builds, and it reports only when the page is served from hatboysoftware.com. Local servers, previews and test runs stay silent.
One detail worth knowing: by default the SDK buffers unsent telemetry in the browser’s session storage so it survives a page change. If your policy treats any browser storage as needing consent, set isStorageUseDisabled too.
What we collect
| Signal | Detail |
|---|---|
| Page views | The page, and the referring site’s host rather than its full URL |
| Core Web Vitals | LCP, INP, CLS, FCP and TTFB from the web-vitals library, with each one’s rating |
| Contact form outcome | Success, validation, throttled, error, network or honeypot, plus the HTTP status |
| Clicks that matter | Phone, email, outbound links and call-to-action buttons, with where on the page they were and, for buttons, the label |
| Blog search | The query, the topic filter, the result count, and whether it found nothing |
| CRM call | Recorded as a dependency with the status the visitor’s browser saw |
Zero-result searches are the most useful line in the table for content planning: they’re questions people brought to the site that we didn’t answer.
The CRM call matters because the edge never sees it. The browser talks to the CRM directly, so only the browser can report that the call failed.
Keeping it off the critical path
The SDK is about 75 KB compressed. We self-host a pinned version alongside the site rather than loading it from a CDN, so an upstream release can’t change our page. Our script injects the SDK only after the page has loaded and the browser is idle. Anything tracked before then is queued.
We measured the cost with Lighthouse, three runs with the telemetry and three without. The median performance score was 67 with it and 68 without. Total blocking time rose from 0 to 5–10 ms, and Largest Contentful Paint didn’t change.
The edge side
Browser telemetry can’t see everything. Ad blockers drop some of it, and bots don’t run JavaScript. So we also log at Azure Front Door, which sees every request.
- Access logs go to a Log Analytics workspace with 90-day retention and a 1 GB daily cap. Front Door doesn’t enable access logs by default; you add a diagnostic setting.
- An availability test requests the home page every 15 minutes from three US locations. It expects a 200 and a known string on the page, and fails if the TLS certificate has fewer than 14 days left. Microsoft recommends at least five locations to separate site problems from network problems. Three is our trade-off for a mostly US audience.
- Four alerts go to a shared inbox: contact-form errors seen in the browser, failed form posts seen at the edge, the availability test failing from most locations, and a 5xx error rate above 10%.
- A workbook puts traffic, conversions, vitals and health on one page.
Trade-offs to accept
Page views are not unique visitors. Without a cookie or a stored identifier, we can’t tell whether ten page views are one person or ten. For a site our size, conversions answer the business questions better than visitor counts anyway.
Browser numbers are a floor. Anyone blocking the telemetry is invisible to it. Use edge logs for total traffic, keeping in mind that they include bots.
Cookie-free reduces, but doesn’t remove, privacy work. Not setting cookies can reduce the consent burden in some jurisdictions. Whether it removes it depends on the law, the data and your other scripts. That’s a question for your counsel, not for us.
What testing taught us
Our own testing polluted the data. Before the hostname check existed, every Lighthouse run against a production build reported as a real visit, inflating page views and skewing Core Web Vitals. The hostname check fixed new data, and the workbook now also excludes headless Chrome, which covers audit tools and some crawlers.
The default batch interval loses short visits. The SDK sends telemetry in batches every 15 seconds by default. It tries to flush when the page unloads, but many of our visits are short, so we lowered maxBatchInterval to 5 seconds.
What it costs
These are East US 2 list prices from the Azure retail prices API in October 2026. Prices vary by region and agreement.
| Item | List price | Our estimate |
|---|---|---|
| Standard availability test | $0.0005 per run | 3 locations × 96 runs a day × 30 days = 8,640 runs ≈ $4.32/month |
| Log search alerts, 15-minute frequency | $0.50 per rule per month | 2 rules ≈ $1/month |
| Metric alerts | First 10 time series free, then $0.10 each | Likely nothing |
| Log ingestion (Analytics Logs) | First 5 GB a month free per billing account, then $2.76/GB | Free while we stay under 5 GB |
| Retention beyond 31 days | $0.12 per GB per month | Small at low volume |
At a small site’s volume, that comes to roughly $5 to $6 a month, mostly the availability test. The ingestion line is the one to watch. It assumes we stay inside the free allowance, so check the workspace’s usage page after the first month. The 1 GB daily cap bounds the worst case at roughly 30 GB a month: 25 GB over the allowance at $2.76 is about $70, plus retention, if a bot flood ever filled it every day. The free allowance is shared by every workspace on the billing account, so other workloads can use it up first.
How we can help
We set up observability that answers business questions, such as whether a lead arrived and whether a page is fast for real users, at a cost proportionate to the system. We do this for public sites and internal platforms on Azure. See our services for how we approach reliability and cost.